
L1.1 Ten Agents, Different Houses: Bias and Variance
Builds on3 notes
Ten agents estimate the same house
Ten equally skilled agents use the same method but have seen different random samples of a hundred sales from one market.
Ask all ten to estimate the same new house. Their predictions form ten numbers.
How widely do they vary? A large spread indicates sensitivity to which training transactions were observed.
Is their average systematically wrong? If the mean estimate misses the conditional mean price, recruiting more identical-method agents does not remove that method’s average bias.
A method can be stable but biased, or correct on average but highly variable. These are distinct components requiring different investigations.
Should we measure average displacement or dataset-to-dataset fluctuation? Fix one query house and separate them.
How different are the agents’ predictions?
Is their average estimate biased?
Why are these separate questions?
DiscussionQ1
What represents different agents mathematically, and which expectations enter squared prediction risk?
Show the reasoning
Each agent represents a different training dataset . The common learning algorithm maps it to a random fitted function .
At fixed query , average over training randomness and a fresh response , independent of the training sample. Any additional training randomness must also be explicitly included.
Let and . Then
Bias measures the average prediction’s displacement; variance measures fluctuations around that average; irreducible noise describes response variability at the same input. Every component is nonnegative.
Different components respond to different changes
- Irreducible risk is fixed for the chosen features and population. More training data does not change it, though additional informative features can change the prediction problem. Here it equals .
- Squared bias belongs to the whole learning procedure at the given sample size. Capacity, regularization, optimization, and finite data can all affect it; it is not simply approximation error.
- Prediction variance measures repeated-training fluctuations. It is not a synonym for estimation error. More data often helps, but arbitrary algorithms have no universal monotonic guarantee.
A high test score alone does not identify the dominant component. Investigate modeling and optimization for systematic bias, instability for variance, and improved features or uncertainty reporting when outcome noise dominates.
Averaging predictions can reduce variation when model errors are not perfectly correlated. It retains their common mean prediction, so a shared bias remains. For nonlinear networks, averaging parameters is different from averaging predictions and does not inherit this guarantee automatically.
Prediction averaging preserves the mean bias; variance reduction depends on correlation.
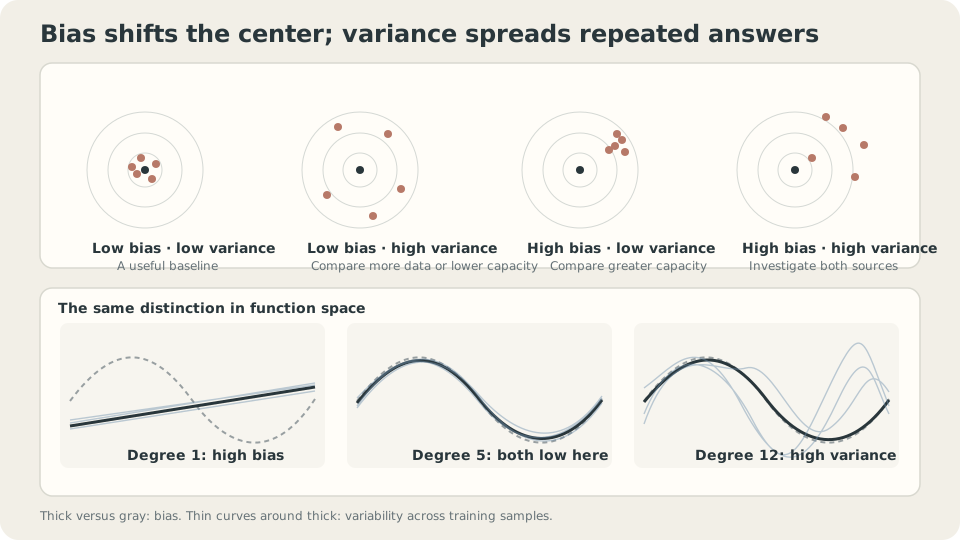
Bias compares the average fitted curve with truth; variance compares each fit with that average.
Derive the decomposition
At fixed , abbreviate , , and . Split the error:
Square and average. Each cross term vanishes: the response residual is centered and independent of training randomness, and the estimator residual is centered over . Hence
This repeats the orthogonality trick in Which Temperature Should We Forecast? MSE Selects the Conditional Mean, now with an extra layer of training-data randomness.
For fixed full-rank linear design, independent homoscedastic noise variance , and parameters, average fitted-prediction variance at the training inputs is
Within this setting, increasing parameter count at fixed design raises this average and increasing appropriate design size can reduce it. The formula does not automatically describe every test grid or nonlinear learning procedure.
CautionThis additive decomposition is specific to squared loss
The clean sum relies on squared-error algebra. Other losses admit different bias–variance frameworks [3], but not this same three-term identity. Under classification loss, variability can sometimes move a biased decision across the correct boundary.
For other metrics, measure their repeated-run mean and spread directly rather than adding squared-loss components. Specify whether randomness comes from data, initialization, or minibatch order; see Three Runs, Three Answers: What Should We Report?.
Interventions and their limits
Widely varying estimates: compare more relevant data, suitable restrictions, regularization, and prediction ensembling. Their effectiveness depends on the source of variation.
Consistent systematic error: inspect missing features and model or optimization restrictions. Averaging more same-law predictions does not change their common mean; more training data can still change the underlying procedure’s bias, so its effect needs checking.
Accurate conditional mean but variable outcomes: report suitable uncertainty or seek features explaining the remaining variability. A point estimator cannot predict independent residual noise.
Repeated-training estimates need representative resampling and enough replications. Shared or correlated datasets alter uncertainty in the estimates. The formula assumes a fresh independent response and squared loss.
Measure the components
Fix thirty input locations and resample only response noise, fitting three hundred datasets per degree:
import numpy as np
from numpy.polynomial import Polynomial
from ml_toy import truth, NOISE
xs,ys = truth()
x = np.linspace(0,1,30)
Y = np.sin(2*np.pi*x)+NOISE*np.random.default_rng(0).standard_normal((300,30))
for d in (1,2,3,5,7,9,12):
    P = np.array([Polynomial.fit(x,yy,d)(xs) for yy in Y])
    bias2 = ((P.mean(0)-ys)**2).mean()
    var = P.var(0).mean()
    print(d,'bias squared',bias2,'variance',var,'noise',NOISE**2,'sum',bias2+var+NOISE**2)
degree bias² variance noise sum
1 0.2004 0.0016 0.0225 0.2245
2 0.2004 0.0022 0.0225 0.2251
3 0.0048 0.0028 0.0225 0.0301
5 0.0000 0.0041 0.0225 0.0266
7 0.0000 0.0053 0.0225 0.0278
9 0.0000 0.0069 0.0225 0.0294
12 0.0000 0.0095 0.0225 0.0320In this experiment, squared bias falls sharply while variance rises, producing the observed risk minimum near degree five. Values rounded to zero are not a proof of exact zero bias. The decomposition is exact; a U-shaped trend as capacity varies remains a property of the procedure and setting.
Read three features of the table:
- Degrees one and two have similar bias at the displayed precision; the added term helps little here.
- Beyond degree five, small additional approximation gains are outweighed by measured variance in this comparison.
- Outcome noise stays fixed at because the data-generating problem is unchanged.
Check the scale: keep degree nine and vary the fixed input-grid size:
for n in (30,100,300):
    x = np.linspace(0,1,n)
    Y = np.sin(2*np.pi*x)+NOISE*np.random.default_rng(0).standard_normal((300,n))
    P = np.array([Polynomial.fit(x,yy,9)(xs) for yy in Y])
    print(n,'grid variance',P.var(0).mean(),'training-input formula',NOISE**2*10/n)
n=30: grid variance 0.0069, training-input formula 0.0075
n=100: grid variance 0.0021, training-input formula 0.0022
n=300: grid variance 0.0008, training-input formula 0.0007The dense-grid average happens to be similar in scale, but its exact conditional variance averages over that grid. Only averaging at the original training inputs gives exactly .
More data can change the entire estimator; only the irreducible risk of a fixed prediction problem is independent of training size.
With zero noise and fixed inputs, deterministic fitting has no repeated-noise variance. Resampling input locations introduces design randomness, which can still change predictions without label noise. Whether it causes large fluctuations in this particular toy must be measured, not assumed.
Explore the components
Specify the resampling experiment before interpreting how data and capacity change the components.
Check your understanding
References
- Geman, S., Bienenstock, E., Doursat, R. Neural Networks and the Bias/Variance Dilemma. Neural Computation 1992.
- Hastie, T., Tibshirani, R., Friedman, J. The Elements of Statistical Learning, 2nd ed. Springer 2009, Ch. 7.3.
- Domingos, P. A Unified Bias-Variance Decomposition and its Applications. ICML 2000.