
L3.1 One Hundred Trials: A Grid or Random Points?
Two settings and one hundred evaluations
Two hyperparameters vary continuously between zero and one. You can afford one hundred evaluations.
A ten-by-ten grid explores chosen combinations; random search draws one hundred pairs. Suppose only one coordinate strongly affects the result.
The grid tries only ten values on that coordinate, repeatedly changing an irrelevant one. Continuous random sampling almost surely tries one hundred distinct values there.
The same nominal budget can therefore explore very different numbers of influential positions.
Which design avoids repeated projections?
Must we know the important coordinates first?
Does projection count prove universal superiority?
DiscussionQ1
For budget in dimensions, count values per coordinate and projected locations when only coordinates matter.
Show the reasoning
A full grid with values per coordinate uses evaluations:
If the budget is a hard upper bound, take . For , dimensions three and five permit four and two values per coordinate, respectively, not rounded counts that exceed the budget.
Independent continuous sampling produces distinct projected coordinate values almost surely. Discrete or categorical coordinates can repeat.
Project onto the influential coordinates:
- A full grid produces only distinct positions.
- Continuous random search still produces distinct positions almost surely.
The redundant-projection fraction is . This counts noiseless evaluations; repeated measurements can still help estimate a noisy score.
Random exploration does not need advance knowledge of the influential coordinates. If , this particular redundancy disappears, but objective shape, grid alignment, and sampling distributions still determine comparative performance.
Look at the projection
Plot both designs in two dimensions and project onto the influential horizontal axis.
- The grid collapses to ten locations, repeatedly evaluated under the noiseless one-coordinate target.
- Random points give one hundred distinct horizontal locations, though they need not be evenly spaced.
This motivates random search in low-effective-dimensional hyperparameter spaces, as studied by Bergstra and Bengio [1]. It explains a mechanism rather than guaranteeing an outcome on every task.
Jittered grids, Latin hypercubes, and other space-filling designs also address aspects of coverage. They are related alternatives, not identical to independent random sampling.
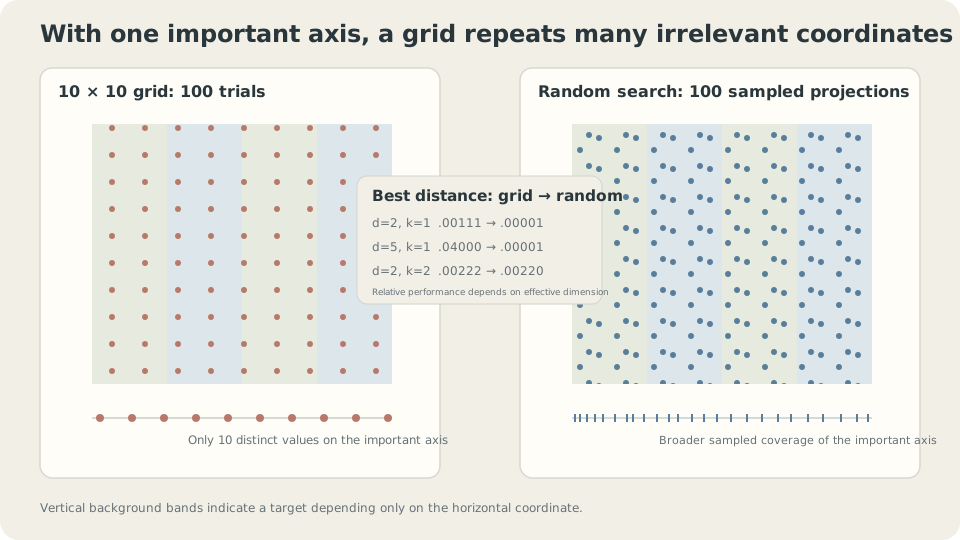
Projection redundancy appears when some coordinates do not affect the noiseless target.
Quantify the example and its limits
Use a target depending only on the first coordinates:
The following original simulation gives random search one hundred points but rounds grid counts. Its grid budgets are 100, 100, 125, 243, 100, and 81. It illustrates resolution effects, not a strictly equal-cost ranking.
d   k    grid minimum   random minimum   grid values per coordinate
1   1    .00001        .00001           100
2   1    .00111        .00001           10
3   1    .00250        .00001           5
5   1    .04000        .00001           3
2   2    .00222        .00220           10
4   2    .08000        .00230           3
Read each comparison with its actual budget.
The one-dimensional results are close at displayed precision. With no irrelevant projection, grid spacing and random gaps still differ; other one-dimensional objectives need not tie.
When only one coordinate matters, adding irrelevant dimensions reduces grid resolution. For the three-value grid , target coordinate 0.3 is missed by 0.2, giving squared error 0.04. That value comes directly from grid placement.
The two-important-coordinate example happens to be close. The redundant-projection argument no longer applies there, but it does not establish equal efficiency in general.
Low effective dimension explains one random-search advantage, not every search outcome.
The four-dimensional example with two influential coordinates shows another substantial resolution gap, subject to its unequal grid budget. Real spaces can have a few dominant settings, but interactions and task-specific importance must be investigated.
SupplementChoose a meaningful sampling scale
Positive settings spanning orders of magnitude, such as rate or penalty, often call for log-scale exploration. Linear-uniform draws put most mass in the numerically largest interval.
Ask whether multiplicative or additive changes are meaningful. Rate and penalty often favor log coordinates; probability parameters need bounded treatment. Near-one momentum can be explored through the log scale of , reflecting its memory time scale.
Neither grid nor random search compensates automatically for a badly chosen range or sampling distribution. Scale choices determine where the budget goes.
Two ways to use more information
Independent random search does not adapt the next candidate to previous scores.
Two families add different information:
Bayesian optimization: fit a probabilistic surrogate to observed settings and scores, then choose a candidate through an acquisition rule balancing predicted quality and uncertainty. Its efficiency depends on model fit, dimensionality, noise, and variable types. It need not use a smooth GP; other surrogates support other assumptions [3].
Successive halving / Hyperband: allocate small budgets to many candidates and retain promising ones for larger budgets. Low-budget evidence must be informative enough about the final objective for this to work well; late-improving configurations can be eliminated prematurely [2].
A random baseline and initial broad exploration can help define ranges and diagnose influential variables before a more elaborate search. There is no universal requirement to run thirty or fifty trials first, nor a universal winner between cold-start methods.
A practical search procedure
- Specify ranges, scales, conditional dependencies, and total compute budget.
- Run an affordable initial exploration, including failed or unstable trials in the log.
- Inspect score-versus-setting plots and interactions; a flat marginal plot does not prove irrelevance.
- Refine useful ranges or use a suitable adaptive or multi-fidelity method.
- Record the entire search procedure for independent evaluation and reporting.
Use consistent development protocols and account for stochastic scores. The noiseless projection example does not identify which observed winner is truly best under evaluation noise. Adaptive search also changes the selection procedure that must later be evaluated.
Inspect the exploratory results
Candidate plots can provide information about response structure, beyond locating one favorable configuration.
Plot each coordinate against development score, with its sampling scale and other settings recorded.
- A visible trend can suggest influence or a useful range.
- An unstructured marginal cloud can reflect weak influence, interactions, inadequate coverage, or noisy scores.
For the additive toy with two influential coordinates, their plots reveal valleys while irrelevant coordinates do not. Restricting attention to those coordinates improves grid resolution, but real interactions may require joint plots or further experiments.
Once only a few well-understood settings remain, a grid can be practical and interpretable.
Search efficiency depends on dimensions, ranges, scales, interactions, and noise.
Compare designs under a stated budget
Track distinct projections and actual evaluation counts as dimension changes.
Check your understanding
References
- Bergstra, J., Bengio, Y. Random Search for Hyper-Parameter Optimization. JMLR 2012.
- Li, L. et al. Hyperband. JMLR 2018.
- Snoek, J., Larochelle, H., Adams, R. Practical Bayesian Optimization of Machine Learning Algorithms. NeurIPS 2012.